Introduction to HexDroid
HexDroid is an all-in-one cloud platform, crafted by developers, to streamline R&D for embedded AOSP (Android) and Linux devices by tackling common development challenges.
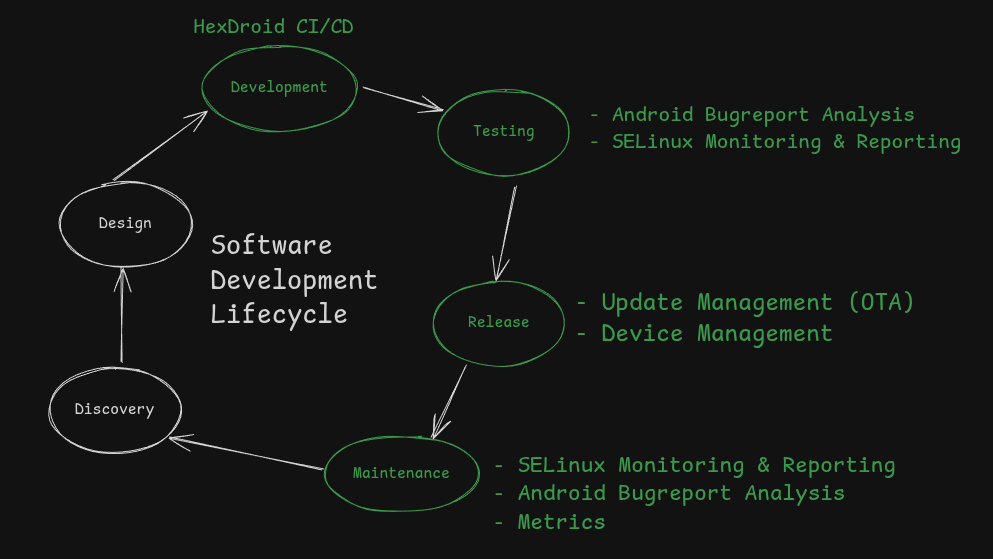
HexDroid seamlessly integrates into the agile software development lifecycle, offering a suite of features.
These include an intuitive CI/CD system designed for AOSP workflows, device monitoring (covering SELinux issues, performance, and custom metrics), Android Bugreport analysis, and over-the-air (OTA) update deployment to both internal teams and customers.

With HexDroid, your team can detect issues earlier, release updates more rapidly, and continuously improve the user experience.
Development
CI/CD for AOSP
HexDroid offers an intuitive CI/CD system designed to tackle the specific demands of AOSP development.
Automate your AOSP build and release processes, enabling your team to deliver updates with greater speed and confidence.
Visit Continuous Integration (CI/CD) for more information.
Visit Setting up AOSP CI/CD Pipeline for more information.
SELinux Monitoring
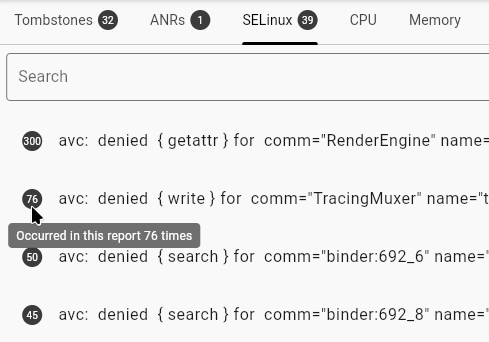
On your devices, HexDroid keeps track of SELinux events automatically and will make reports available to you on the
HexDroid web application as soon as they're uploaded.
All reported issues are grouped, and displayed in HexDroid app so that they can be triaged, and get looked at by
developers.

To integrate SELinux monitoring, visit SELinux Monitoring page.
Android Bugreport Analysis
HexDroid keeps track of all uploaded Android Bugreports, and provides deep analysis of all bugreports, from summarizing all ANRs/Crashes that were seen, to visualizing CPU/Memory/Battery usage and more!


To use Bugreport feature - visit Android Bugreport for more information.
Release
Over-the-Air (OTA) Updates
Seamlessly deploy and manage software updates across your entire fleet - whether it's Android, Linux, IoT, or custom applications.
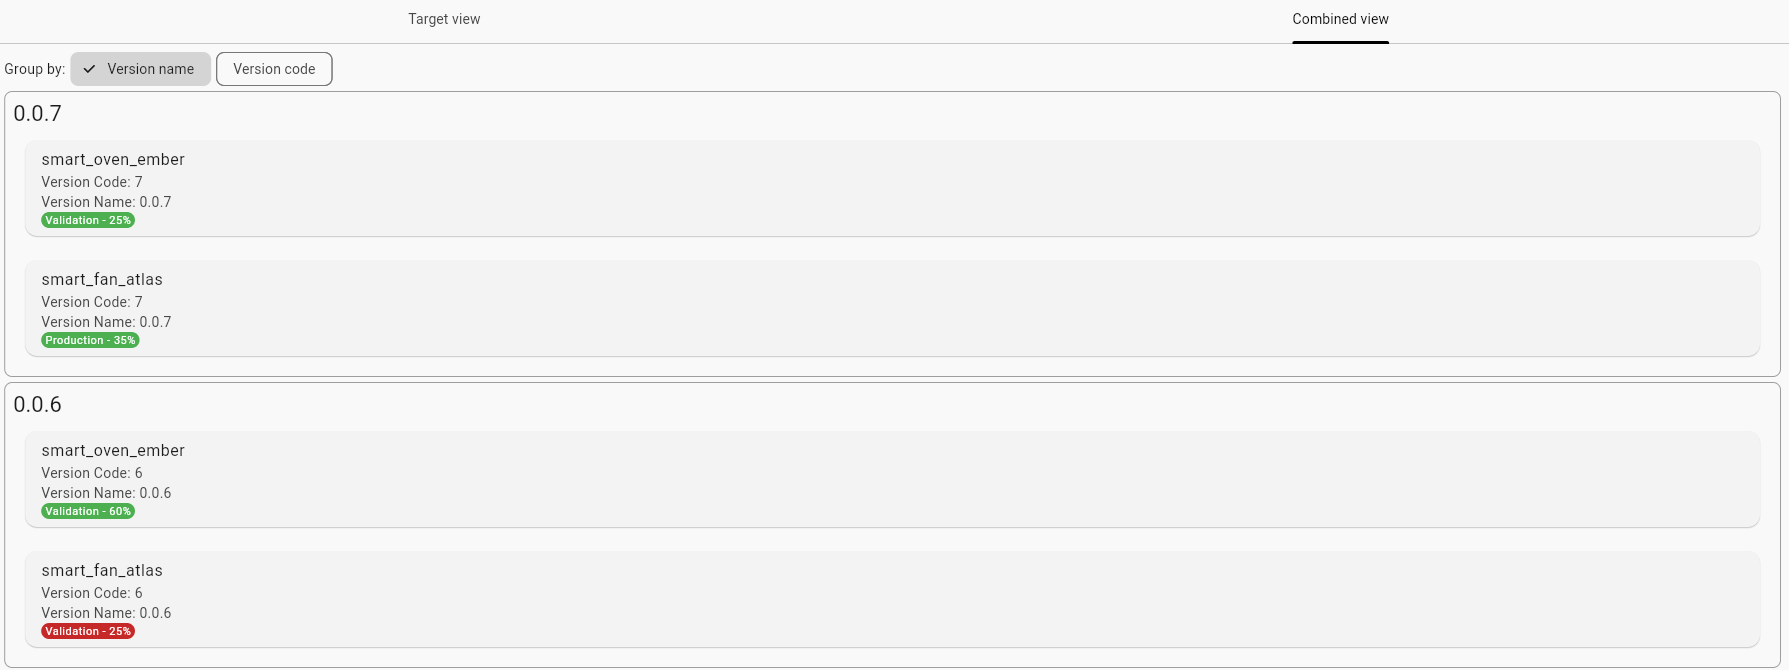
HexDroid’s OTA solution makes rollouts safer and smarter with tools to control releases, configure payloads, and validate updates at scale.

Visit Update Management (OTA) for more information.
Monitoring
Metrics
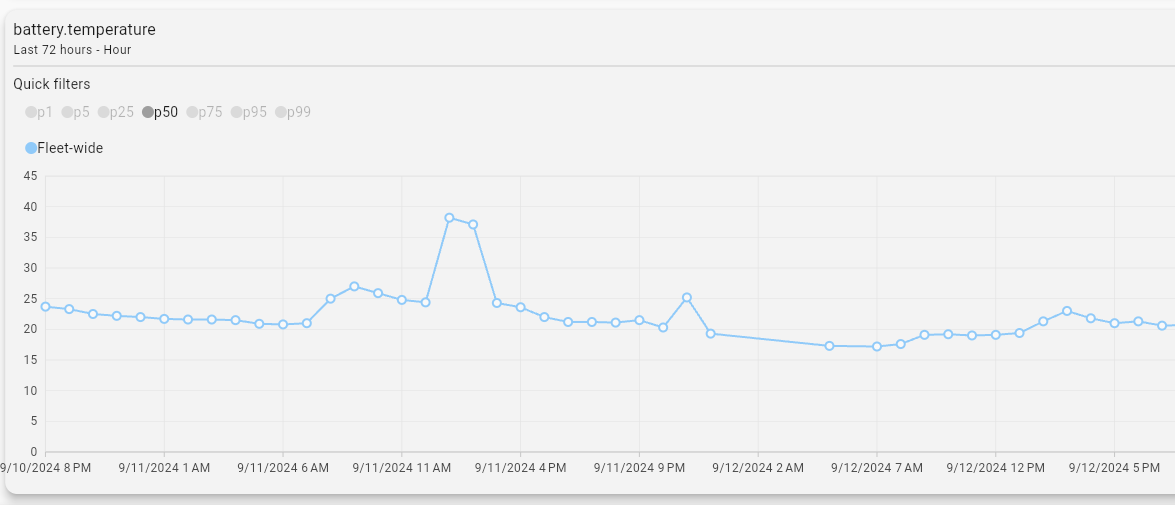
HexDroid’s powerful metric system gives you full visibility into the health, performance, and usage patterns of your entire fleet - whether it’s Android devices, IoT systems, or embedded platforms.
With customizable metrics, you can track everything from low-level technical data (e.g., battery voltage, error rates) to high-level product usage insights (e.g., feature adoption, state transitions). This empowers teams to monitor fleet performance in real time, proactively detect issues, and make data-driven decisions that improve reliability and user experience.

HexDroid’s flexible charts and aggregations - ranging from percentile tracking to cumulative sums - help uncover trends, outliers, and correlations across different device models, software versions, and configurations.


By fusing metrics, filtering by device properties, and comparing data across dimensions, HexDroid transforms raw telemetry into actionable insights that drive better products and faster issue resolution at scale.

Adding metrics is straightforward with HexDroid’s SDKs, allowing engineers to expand data collection without needing to overhaul backend systems. The more metrics you add, the richer the insights, enabling smarter decisions across engineering, product, and support teams.
Visit Metrics Overview for more information.